India key economic indicators upsc 2026-27
India key data Population, banking and economy India key economic indicators upsc
INDIA GDP & INTERNATIONAL TRADE DATA UPSC 2023
India key Economic indicators UPSC
Gross Domestic Product(GDP)
Nominal GDP - $4.332 Billion (3rd behind US, china & Japan)
Purchasing power parity GDP - $13.119 Billion (3rd behind US & China)
INTERNATIONAL TRADE
Trade data 2021-22, 2022-23 & 2023-24
| 2021-22
(USD Billion) |
2022-23
(USD Billion) |
2023-24
(USD Billion)Estimate |
||
| Merchandise | Exports | 422.00 | 451.46 | 437 |
| Imports | 613.05 | 715.9 | 677.24 | |
| Trade Balance | -191.05 | -266.78 | 240 | |
| Services* | Exports | 254.53 | 322.72 | 339 |
| Imports | 147.01 | 177.94 | 177.5 | |
| Net of Services | 107.52 | 144.78 | 162 | |
| Overall Trade (Merchandise+
Services)* |
Exports | 676.53 | 770.18 | 776.68 |
| Imports | 760.06 | 892.18 | 854.80 | |
| Trade Balance | -83.53 | -122.00 | 78.12 |
Balance of payments = Trade balance + Balance in capital account + Balance in financial account
Trade balance - The current account is used to mark the inflow and outflow of goods and services into a country.
Balance in capital account – It includes all international capital transfers such as remittances or proceeds of asset sales by migrants leaving or entering a country, the transfer of ownership on fixed assets.
Financial account - International monetary flows related to investment in business, real estate, bonds, and stocks are documented. Also included are government-owned assets, such as foreign reserves, gold, special drawing rights (SDRs) held with the International Monetary Fund (IMF), private assets held abroad, and direct foreign investment. Assets owned by foreigners, private and official, are also recorded in the financial account.
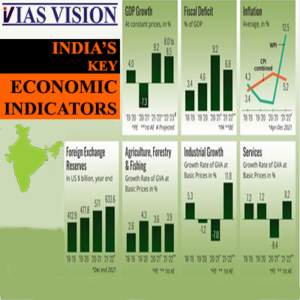
Forex reserves - The country’s Forex reserves, which stood at $606.47 billion on 1 April 2022, the beginning of the fiscal 2022-23, slumped to $578.44 billion on March 31, 2023, posting a decline of $28.03 billion during the year.
In the week ended 5th , April 2024, country’s Forex reserves stood at US$648.095 billion.
In the week ended 27th , September 2024, country’s Forex reserves stood at US$704.895 billion.(on valuation gains and the central bank's dollar purchases.)
Final impact of Balance of payments is reflected in Foreign exchange reserves (FOREX) of a country.
Remittances to the country by non-resident Indians rose 26% on year to about $112.5 billion in FY23, underscoring the surge in demand for Indian professionals globally after the pandemic. Remittances to India were $89.1 billion in FY22.
Foreign direct investment (FDI) into India declined by 22 per cent to USD 46 billion in 2022-23. India is placed outside top 10 of global top 10 FDI recipient list led by china & US. This is also an indicator of the journey India's reforms have to cover. currently, India's ease of doing index stands at a lowly 63 in 2022 world bank report.
India key economic indicators
INDIA FOREX & BUDGET SIZE DATA UPSC
India key economic indicators upsc
FOREX RESERVES
India's foreign exchange reserves (December 1, 2023)
COMPOSITION:
- Foreign currency assets - 533,610
- Gold - 47,329
- SDRs - 18,250
- Reserve Tranche Position - 4,853
In October 2021, the nation's foreign exchange reserves achieved a historic peak of USD 645 billion.
Budget size
- Budget expenditure - $549.14 billion(17% of GDP)
- Fiscal deficit target - 5.9% of GDP for 2023/24
- Expected economic growth in 2023/24 - 6-6.8% of GDP
Share market size
India is now the fifth country in the world with an equity market Capitalisation of $4 trillion, , behind the US, China, Japan, and Hong Kong.
This includes all companies listed on all stock exchanges.
INDIA POPULATION DATA UPSC 2023
Population
The current population of India is more than 1,43.4 crores in December 2023, based on the United Nations figures.
- India population is equivalent to 17.76% of the world population.
- India ranks number 1 in the world.
- The population density in India is 481 per Km2 (1,244 people per mi2).
- 3 % of the population is urban (518,239,122 people in 2023)
- The median age in India is 28.2 years.
INDIA EXTERNAL DEBT
EXTERNAL DEBT:
In september 2023, India's external debt stood at US$ 630 billion.
INTERNAL DEBT:
In september 2023, India's Internal debt stood at 90% of GDP..
INDIA MONETARY POLICY KEY RATES DATA 2023 UPSC
Monetary policy key rates
India key economic indicators
| Key Indicators December, 2023 | December, 1991 | ||
| Indicator | Current rate | ||
| CRR | 4.50% | 25% | |
| SLR | 18.00% | 38.5% | |
| Repo rate | 6.50% | ||
| Reverse repo rate | 3.35% | ||
| Marginal Standing facility rate | 6.75% | ||
| Bank Rate | 6.75% | 11.00% | |